Brand & Marketing
Impressions measure loudness.
TVI measures what stays in culture after the algorithm moves on.
Temporal Validation Index™ — Patent Pending. Unauthorized commercial use prohibited. © 2026 BoonMind.io
Quantitative modelling for persistence, resilience, and long-horizon durability.
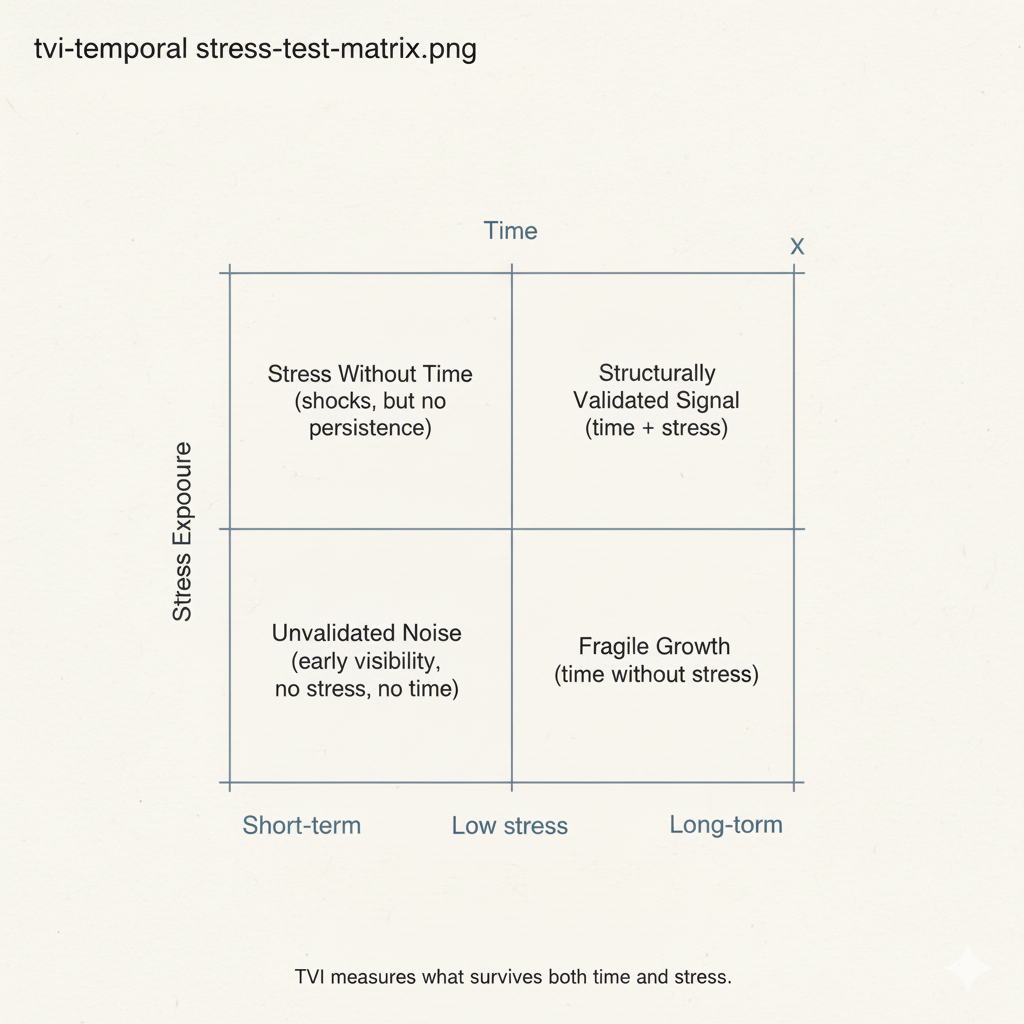
The TVI framework explores why some ideas compound, institutions endure, datasets persist, and systems survive stress across time.
TVI = CSI × log10(TVS + 1) × SRC
Public framework abstraction layer. Where CSI = Cultural Saturation Index, TVS = Temporal Validation Score, and SRC = Structural Resistance Coefficient.
Advanced deployments may incorporate recursive sensitivity weighting, domain-specific calibration, structural Greeks, adaptive deltas, ensemble modelling, and bespoke scoring architectures.
TVI combines temporal validation, structural resistance, adaptive resilience, and persistence dynamics into a unified analytical framework for evaluating durability across domains.
Applications include institutional resilience analysis, investment durability screening, AI dataset persistence evaluation, business methodology longevity, and cultural and memetic persistence mapping.
The framework is experimental, systems-oriented, and designed to explore long-horizon structural behaviour rather than short-term popularity signals.
Persistence is not the same as resilience. Survival is not the same as compounding.
Now entering controlled beta evaluation across selected domains including institutional analysis, organisational resilience, and temporal signal research. Research collaborators and early partners welcome.
Patent Pending · Brand Analytics · Investment Analysis · AI Data Curation · Unauthorized commercial use requires a license.
Impressions measure loudness.
TVI measures what stays in culture after the algorithm moves on.
ROI measures upside.
TVI is designed to surface structural fragility before it becomes obvious.
Downloads measure popularity.
TVI measures which datasets will still be training models in 10 years.
TVI = CSI × log₁₀(TVS + 1) × SRC
Long-horizon cultural persistence vs. disposable virality.
Charlie Bit My Finger TVI 67.52 vs TikTok trend TVI 0.00
Run Analysis →Dataset durability for models that must survive benchmark churn.
MNIST TDIS 40.21 vs LAION-5B TDIS 0.00
Run Analysis →Which operating systems compound vs. consulting wallpaper.
SMART Goals TVI-B 1,031 vs Holacracy TVI-B 0.17
Run Analysis →Structural staying power beneath market narrative.
Apple ISPS 7,775 vs Peloton ISPS 82
Run Analysis →Yes, the formula is published. The formula is the tip of the iceberg. Here is what lives underneath it.
The Structural Resistance Coefficients, era boundaries, A-Factor decay curves, and Legacy Level weightings are calibrated values built from research. The formula is the shell. The coefficients are the engine. They are not fully published.
What does Available Audience mean for a 1987 business methodology vs a 2023 TikTok trend? The platform handles era-specific normalization logic that a spreadsheet cannot replicate without years of domain calibration.
A number without context is meaningless. TVI compares your result against a calibrated library of historical entities. Your spreadsheet has no reference class.
A spreadsheet gives you a number. TVI gives you a classified, benchmarked, downloadable PDF report with sensitivity analysis, competitive set comparison, and a defensible methodology citation.
Agencies and analytics teams do not run one analysis. They run hundreds. The API embeds TVI into your own dashboards, client reports, and data pipelines. A spreadsheet does not scale.
A TVI license gives you the right to use the methodology in client deliverables and investment decisions. Unauthorized use carries IP infringement liability. For institutional investors and consultancies, that distinction is existential.
Illustrative retrospective analysis suggests the framework may have identified structural fragility signals inconsistent with the prevailing market narrative during the WeWork expansion period.
The example is exploratory and should not be interpreted as demonstrated predictive investment performance.
SoftBank Vision Fund quarterly reports 2019–2020 provide the reported write-down context.
Pedagogical standard for 26 years. Still the benchmark dataset when models 1,000x larger have been retired.
Universal management standard since 1981. Agile scores 316. Holacracy scores 0.17. Time told the truth.
Foundation status. A random TikTok trend scores 0.00. Virality is not validation.
Calculator outputs are demonstrative. Commercial use, investment decisions, and client deliverables require a license. Patent Pending.
Stop measuring reach. Start measuring cultural durability. TVI shows which campaigns build equity and which evaporate after the next algorithm update.
Request Brand Analytics Access →Prove to clients that your work lasts beyond the campaign window. TVI gives agencies a metric that survives the next platform shift.
Request Agency Access →ISPS complements fundamentals with structural staying power. Identify foundations before the market prices them in — not after.
Request Investment Access →Filter training data by temporal validation, not download count. TDIS reduces model brittleness at the source before it costs you a retraining cycle.
Request Data Access →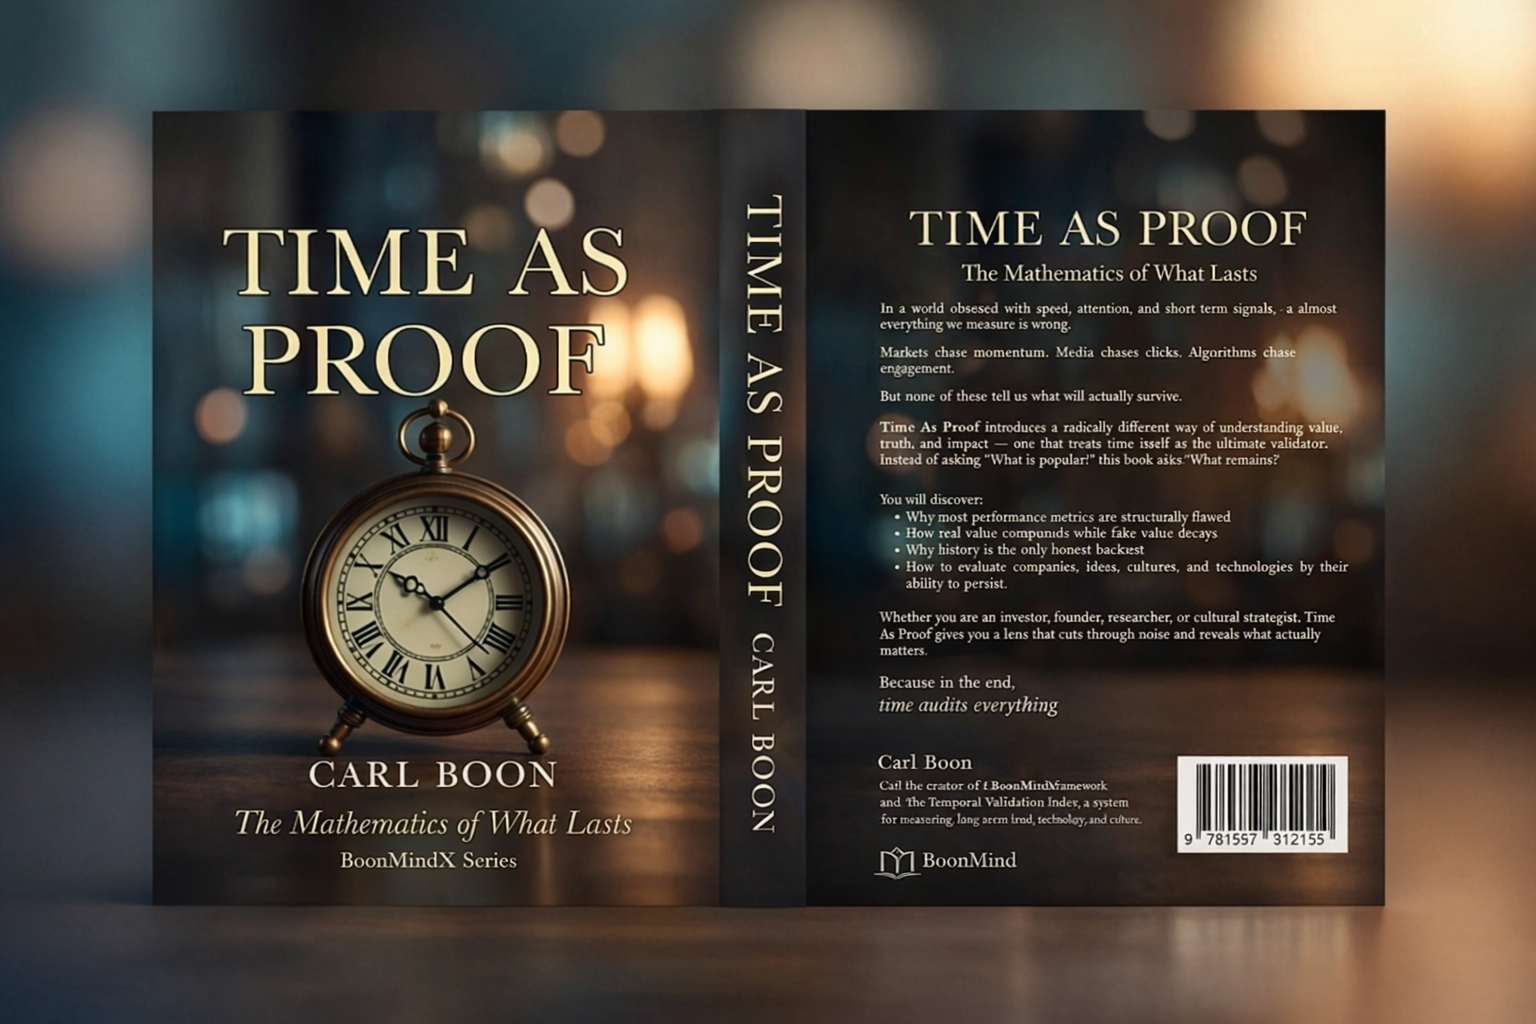
BoonMindX Series
The Mathematics of What Lasts
The complete framework behind TVI — in full. 100 numbered founding copies. The mathematics, the methodology, and the case studies.
Founding Reader Edition — $19.95 digital / $39.95 hardcover + digital
Regular price $39.95 digital. First 100 readers only.
$0
$49/mo
Contact
View full pricing and licensing details →
Evaluation access provides expanded capabilities, full methodology documentation, and framework licensing discussion. For API integration, white-label deployment, or enterprise contracts — this is where it starts.